Author: Lyons, D.; Dayne, S.; Shahab, N. | June 20, 2019 | Technology Update
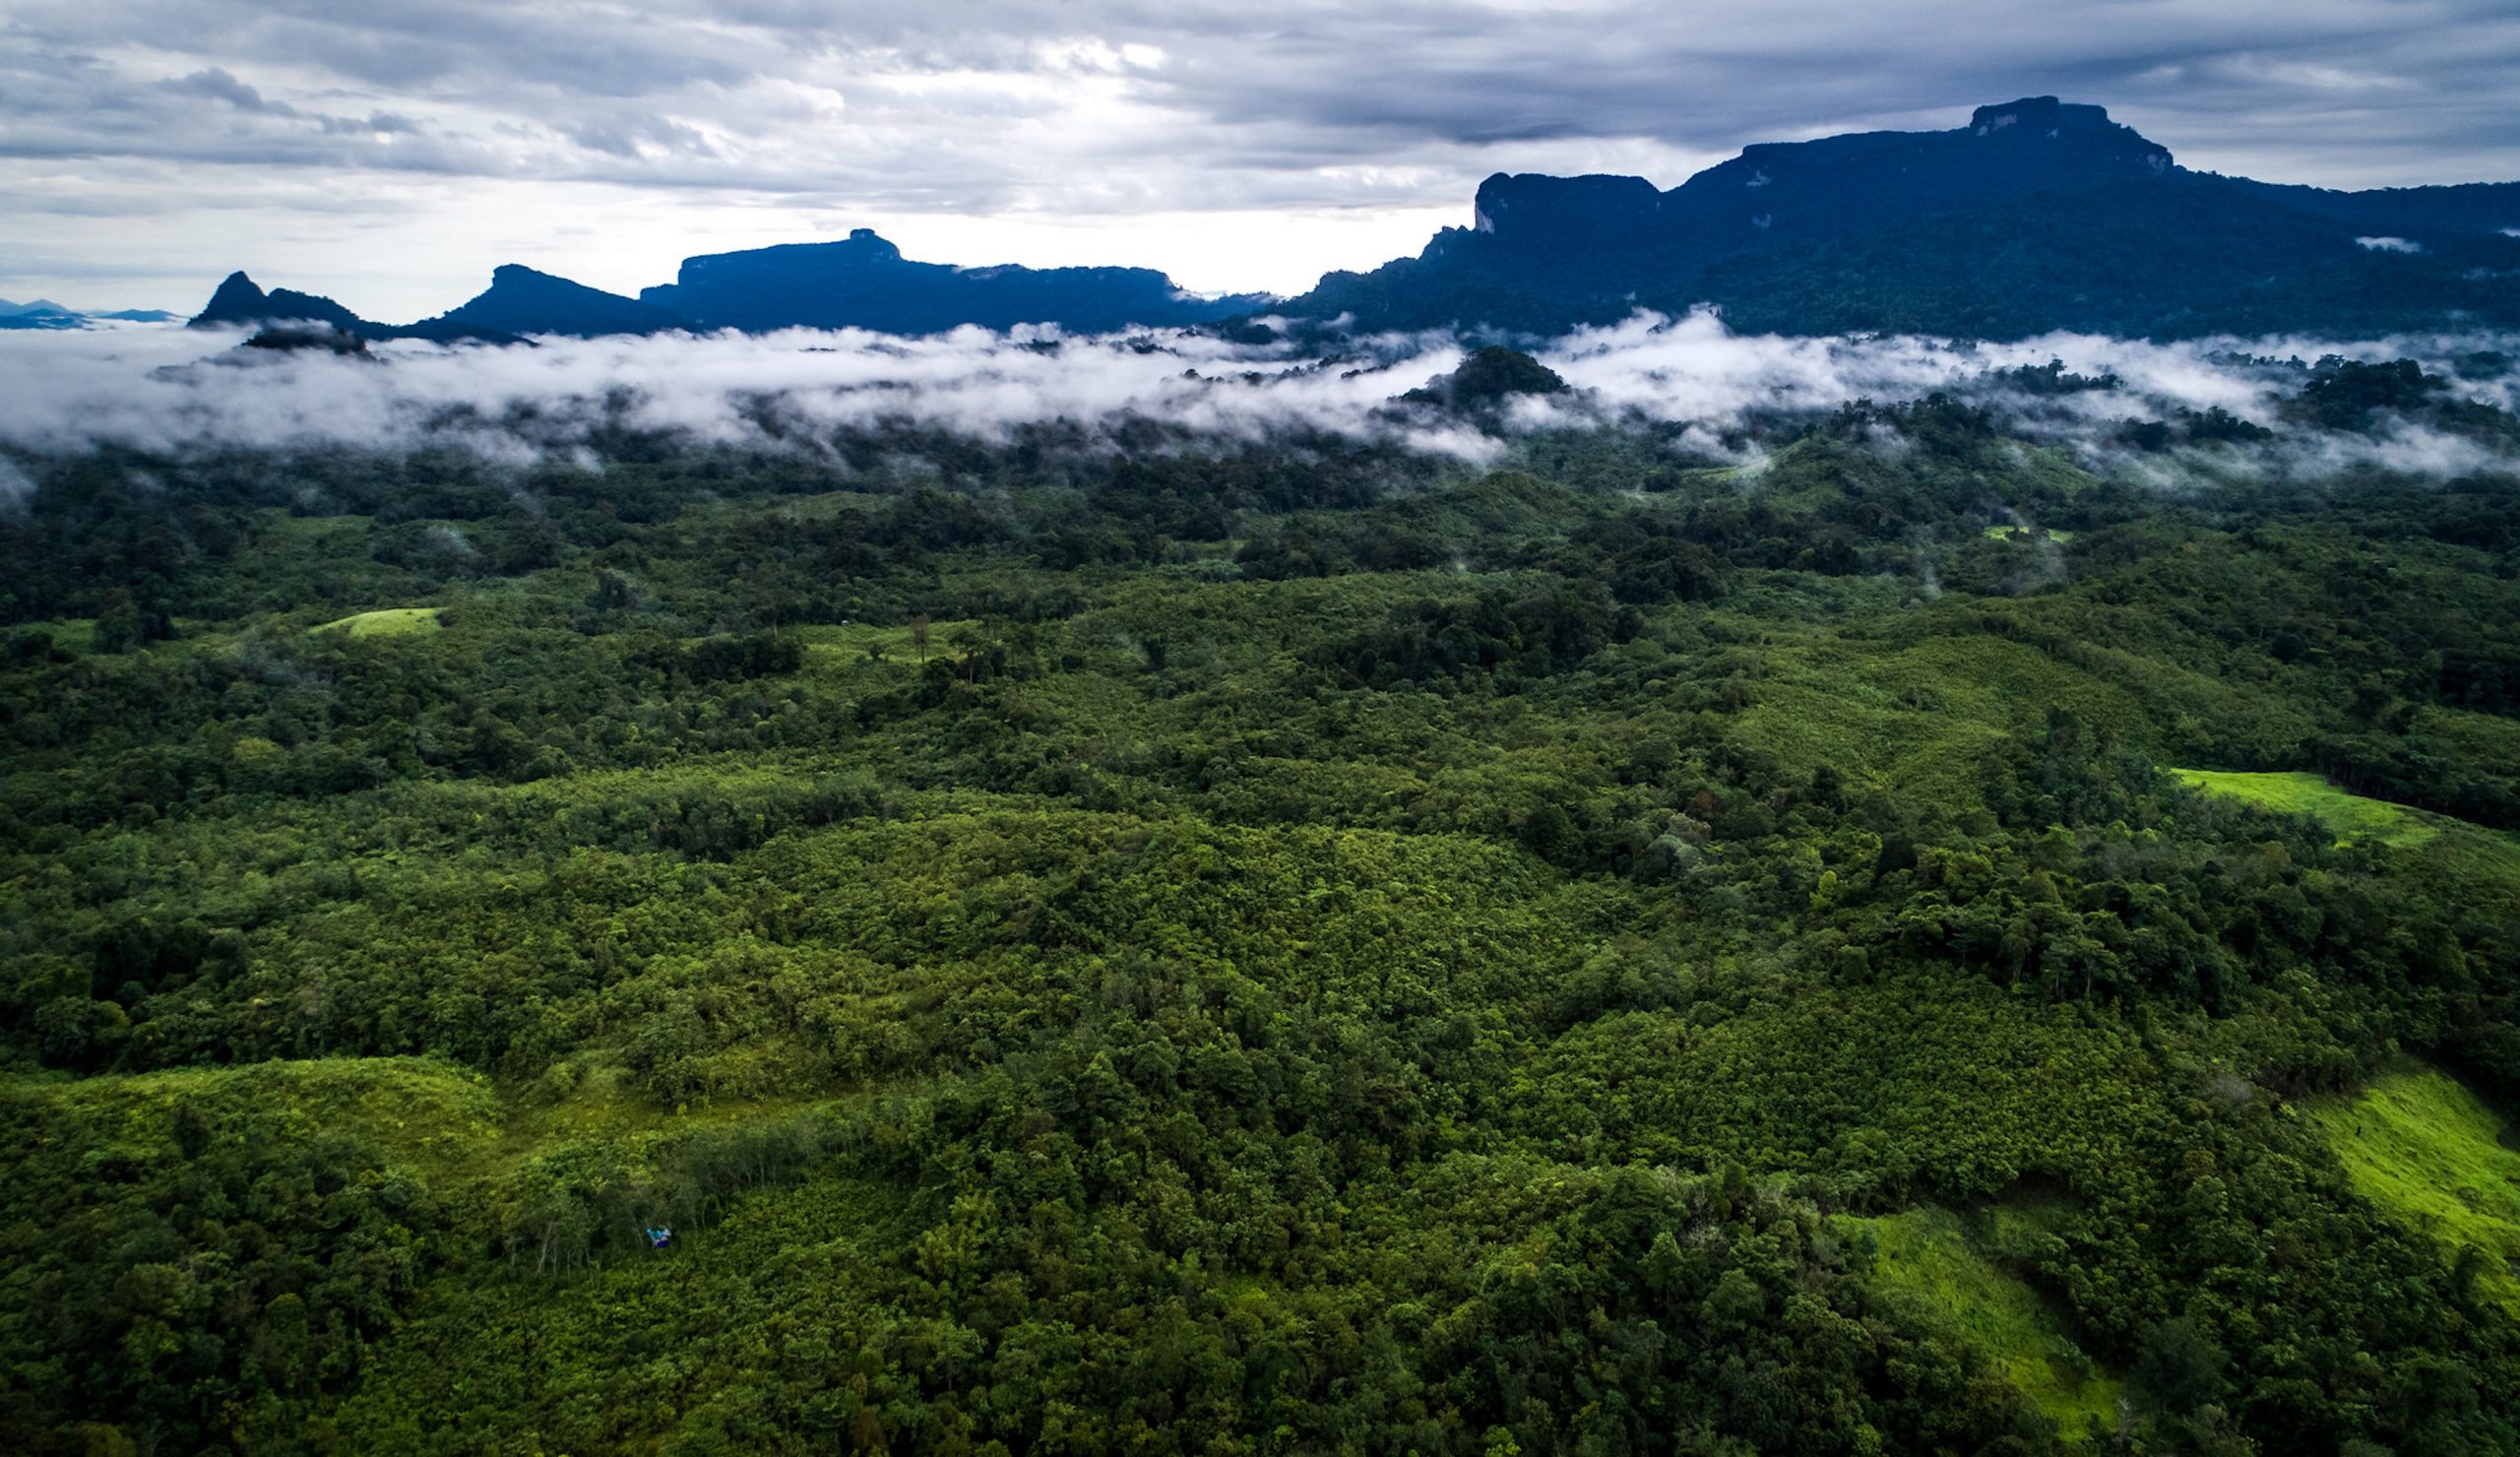
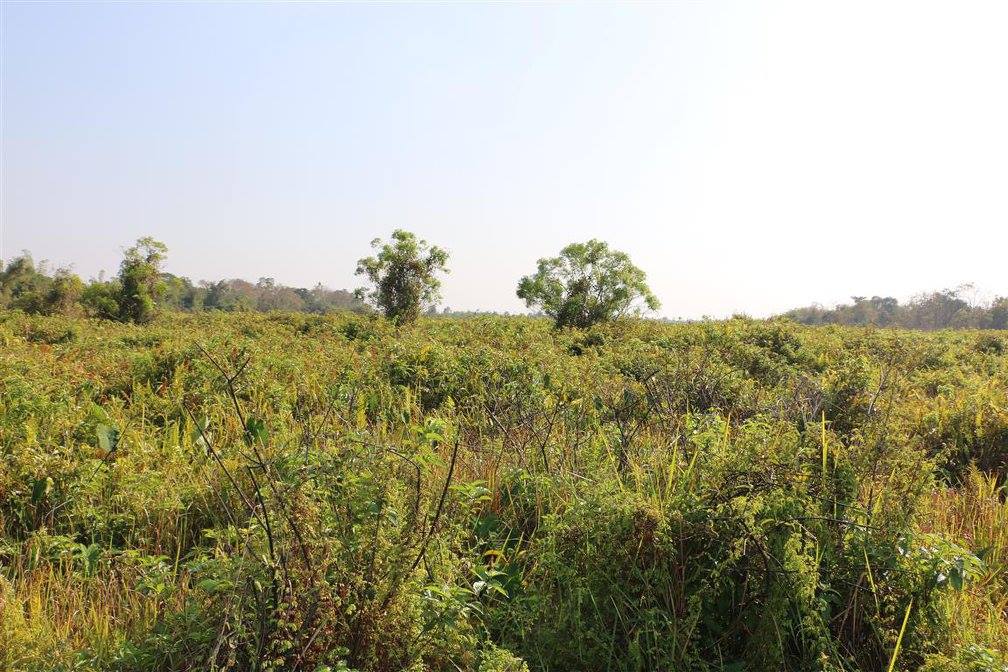
The forests of Borneo are some of the most ecologically diverse in the world, home to thousands of unique species of trees, plants, and wildlife. Estimated to be an ancient 140 million years old, it has taken just four decades to destroy nearly half of the island’s natural vegetation. How do we protect what’s left? Scientists at the Center for International Forestry Research (CIFOR) say the answer lies in knowing which plants are growing and where.
On the Indonesian side of Borneo in West Kalimantan, just north of its Danau Sentarum National Park, lies a forested area endowed with very deep peatlands. Peatlands store more carbon than all of the world’s vegetation combined, and as such, hold a significant role in global goals to combat climate change.
But when a palm oil producer applied for an application to build a plantation on this rich carbon sink, he was granted permission. This was in spite of a moratorium on peatland development by the Indonesian government. So how did this happen?
“Incorrect maps,” says principal ecology scientist at CIFOR, Yves Laumonier.
“When the issuing officer checked the official government maps, the area was classified as ‘non peatland,’ meaning agriculture conversion could take place.” In this situation, peatlands transform from millennia old carbon sink to turbo carbon source in an instant.
“This is a problem with small scale maps and poor spatial data. When you zoom in on a specific location, you often find a lot of errors,” he says.
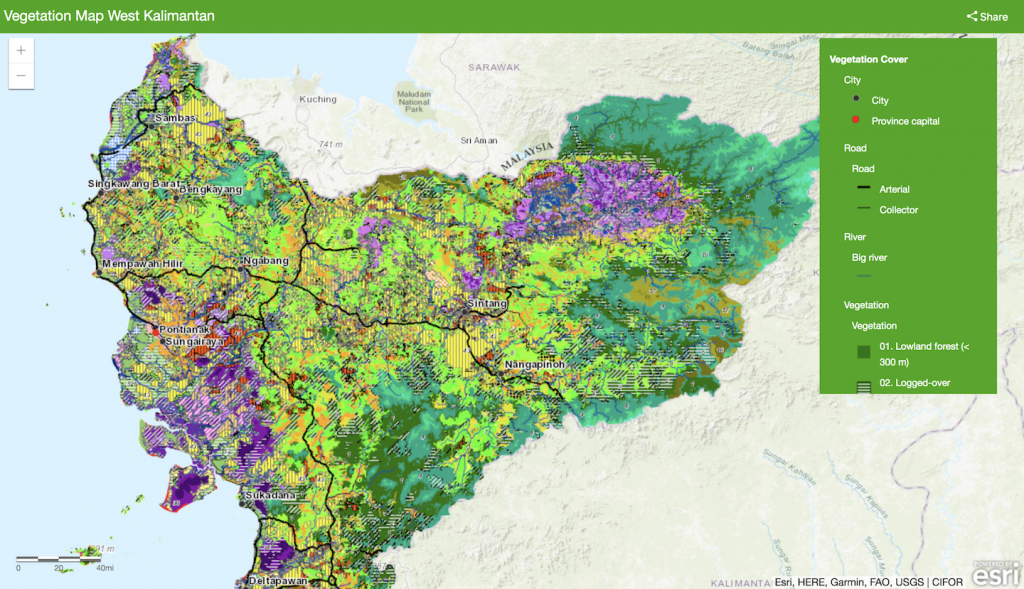
CIFOR’s recent undertaking could then be classed as both timely and necessary. Laumonier has led a team of scientists in developing Indonesia’s most extensive landscape management research in history – analyzing over 400,000 square kilometers of land in West Kalimantan in Borneo. Resulting from the study is large-scale ecological vegetation maps covering the entire province. Using a scale of 1:50,000, the maps detail more than 60 classes of natural and man-made vegetation found in mangrove lined coasts to mountain ridge, and all that’s in-between. This includes logged-over areas, peat swamps, oil palm estates, mixed agroforestry systems, mosaics of fallows and smallholder agriculture.
The hope is that better information will lead to better land use. Ultimately this means that development on protected areas does not happen again. In the aforementioned case, not only was the peat swamp forest cleared, but the palm oil company then went bankrupt, leaving “ecological disaster behind for the local communities, whose fishing grounds had been badly affected.”
“It could have been avoided if decision makers had maps with more detailed and accurate information,”says Laumonier.
Large scale map-making is an epic process. The landscapes are pre-stratified- defined into blocks-geomorphology – which defines the earth’s physical features, climate, soil type, catchment area, and elevation class. This data is then interpreted using a combination of supervised classification- where image software is guided by the user to specify land cover of interest- as well as manual digitization, which requires extensive crosschecking. The cartographers assess information gathered from field surveys, looking at every vegetation type, plant structure, its distribution, and the landscapes successional stages – or how the vegetation naturally regenerate over time .
The various types are then color-coded using symbols based on the cartographic principles of ecological mapping, with one color representing one vegetation type and its succession. For example, a solid green color is assigned to lowland forest, and its first degradation level; logging is represented by green mixed with horizontal white stripes, indicating the depletion of the original forest type.
CIFOR’s vegetation maps provide very useful information for the implementation of the One Map Policy
Nurwadjedi
Smaller scale ecological mapping in Indonesia goes back to the 1980s, with larger scale maps making their entry in the early 2000s. In 2013, a new government regulation directed regencies to generate operational maps at a larger-scale of 1:50,000, in order to improve the level of land management.
In a bid to settle land disputes, recognize Indigenous rights and better conservation efforts, current President of Indonesia, Joko Widodo, took the idea one step further when he announced a One Map Policy in 2016.
As well as regulating a standardization of maps, the policy includes ambitious plans for a centralized geospatial information database and online portal, to aid government in better planning and decision making.
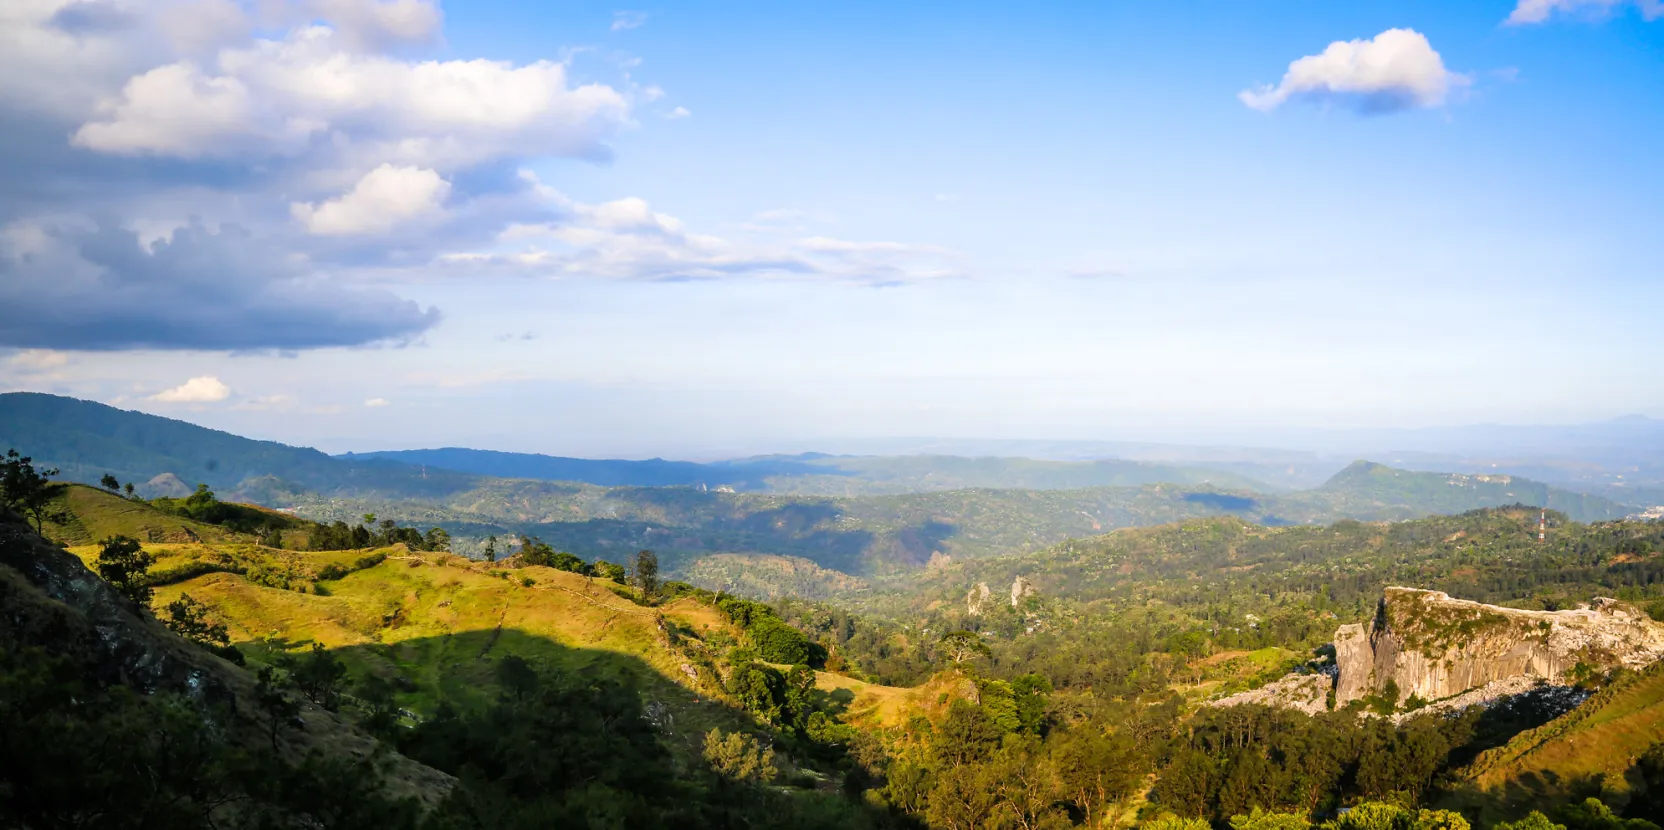
Vegetation maps are critical for any land use decisions, as they reveal the health of an environment and livelihood potential. The growth of trees and plants, and their condition, indicate how fertile the soil is and the availability of groundwater. For example, a landscape rich in diverse vegetation means a provision of ecosystem services– from clean water to an array of foods from fish to fruits- is provided for free to its people and wildlife.
It is an operational scale that is detailed enough to be used in land management
Yves Laumonier
“CIFOR’s vegetation maps provide very useful information for the implementation of the One Map Policy and could consider using these maps under a new theme to be included in their national database, “says Nurwadjedi, Deputy Head of The Geospatial Information Agency (BIG), who is overseeing the country’s mapping standardization work.
Laumonier believes West Kalimantan’s vegetation maps can benefit both the public and private sector, who can use them to determine land allocation, manage whole ecosystems, and recognize specific forest types and areas for conservation, as they detail both logged-over and pristine forests.
What’s more, it can also identify various peat depths through the identification of four different swamp forest types. “It is an operational scale that is detailed enough to be used in land management,” says Laumonier. This has global significance. According to the UN, the protection and restoration of peatlands is vital ‘towards the transition of a low carbon and circular-economy society.’
We want the maps to be accessible to everyone
Yves Laumonier
CIFOR is working with the Ministry of Environment and Forestry to compare and resolve differences in classification, data sources, and base maps. In West Kalimantan, the province is already looking to use the maps in future planning to help preserve and restore the provinces natural landscapes.
“These detailed vegetation maps can be very useful in assisting our provincial government review its land use practices and better guide the preparation of our next mid-term development plan and forest management units,” says Yuslinda, a senior official from the Provincial Development Planning Agency (Bappeda).
“We want the maps to be accessible to everyone,” adds CIFOR’s principal landscape ecologist, Yves Laumonier. To do just this, his team have used freely available Landsat images, instead of higher resolution maps that come with a cost to boot.
Though the maps are extensive, to Laumonier the work can always be improved, “the good news is that now we can start using new free satellite data with better resolution, such as Sentinel 2,” he adds.
Article link: https://forestsnews.cifor.org/61158/zoom-in-on-borneo-ecology?fnl=en


Author: Monica Evans
June 4, 2025
Author: SUPA Component 1
December 18, 2024

Author: Vong Sok, Swetha Peteru, Sinta Haryati Silviana, Monica Evans
November 21, 2024